
はじめに
Pythonでブロック図を作成したいです。
とりあえず、ブロック2つで作ってみました。
サンプルコード
import matplotlib.pyplot as plt
import matplotlib.patches as patches


class _Wire_config:
    def __init__(self, name, x, y, direction, connect_to="", disable=False):
        self.name = name
        self.x = x
        self.y = y
        self.connect_to = connect_to
        self.disable = disable
        if direction == "in":
            self.direction = "->"
        elif direction == "out":
            self.direction = "<-"
        else:
            self.direction = "<->"


class Create_circuit:
    def __init__(self, dut, blocks):
        self.fig = plt.figure()
        self.ax = plt.axes()

        height = 200 + 10*self._count(dut, blocks)

        # Draw DUT
        start_w = 100
        start_h = 50
        end_w = start_w + 100
        end_h = start_h + height - 50

        self._draw_block(start_w, start_h, end_w, end_h, "dut")
        dut_ports = [i for i in self._draw_port(dut, end_w, start_h, "dut")]

        # Draw Verification Components
        start_w = 300
        start_h = 50
        end_w = start_w + 100

        for k, v in blocks.items():
            end_h = start_h + 50 + 10*len(v)
            self._draw_block(start_w, start_h, end_w, end_h, k)

            # Draw Verification Component Ports
            for component_port in self._draw_port(v, start_w, start_h):
                if component_port.disable:
                    continue

                # Draw line from dut to component
                for dut_port in dut_ports:
                    if component_port.connect_to != dut_port.name:
                        continue

                    self.ax.annotate(
                        "", xy=(component_port.x, component_port.y),
                        xytext=(dut_port.x, dut_port.y), size=10,
                        arrowprops={"arrowstyle": component_port.direction, "color": "black"}
                    )

            start_h = end_h + 10  # For Next Component

    def run(self):
        plt.axis("scaled")  # サイズをいい感じにする
        plt.axis("off")  # 目盛りを消す
        plt.show()
        self.fig.savefig("circuit.png")

    def _draw_block(self, start_w, start_h, end_w, end_h, name):
        self.ax.add_patch(patches.Rectangle(
            xy=(start_w, start_h),
            width=end_w - start_w, height=end_h - start_h,
            fill=False,
        ))

        plt.text((start_w+end_w)/2, start_h, name, ha="center",
            fontdict=dict(fontsize=8), bbox=dict(boxstyle="round",color="white"))

    def _draw_port(self, block, start_w, start_h, mode=""):
        _offset_h = 10
        for k, v in block.items():
            if mode=="dut":
                self.ax.add_patch(patches.Circle(
                    xy=(start_w, start_h + _offset_h), radius=3, color="black"))

                plt.text(start_w - 5, start_h + _offset_h, k,
                    fontdict=dict(fontsize=6), ha="right")

                yield _Wire_config(
                    k, start_w, start_h + _offset_h,
                    v["direction"],
                    v["connect_to"],
                    v["disable"],
                )
            else:
                self.ax.add_patch(patches.Circle(
                    xy=(start_w, start_h + _offset_h), radius=3, color="black"))

                plt.text(start_w + 5, start_h + _offset_h, k,
                    fontdict=dict(fontsize=6), ha="left")

                yield _Wire_config(
                    k, start_w, start_h + _offset_h,
                    v["direction"],
                    v["connect_to"],
                    v["disable"],
                )
            _offset_h += 20  # For next port

    def _count(self, dut, block):
        cnt = 0
        for i in block.values():
            cnt += len(i.keys())
        return max([len(dut.keys()), cnt])

if __name__ == "__main__":
    dut = {
        "clk": {"direction": "in", "connect_to": "", "disable": True},
        "reset_n": {"direction": "in", "connect_to": "", "disable": True},
        "din": {"direction": "in", "connect_to": "", "disable": ""},
        "valid": {"direction": "in", "connect_to": "", "disable": ""},
        "ready": {"direction": "out", "connect_to": "", "disable": ""},
        "dout": {"direction": "out", "connect_to": "", "disable": ""},
    }
    blocks = {
        "Model": {
            "clk": {"direction": "in", "connect_to": "clk", "disable": True},
            "reset_n": {"direction": "in", "connect_to": "reset_n", "disable": True},
            "data": {"direction": "out", "connect_to": "din", "disable": ""},
            "valid": {"direction": "out", "connect_to": "valid", "disable": ""},
            "ready": {"direction": "in", "connect_to": "ready", "disable": ""},
        },
    }
    a = Create_circuit(dut, blocks)
    a.run()
実行結果
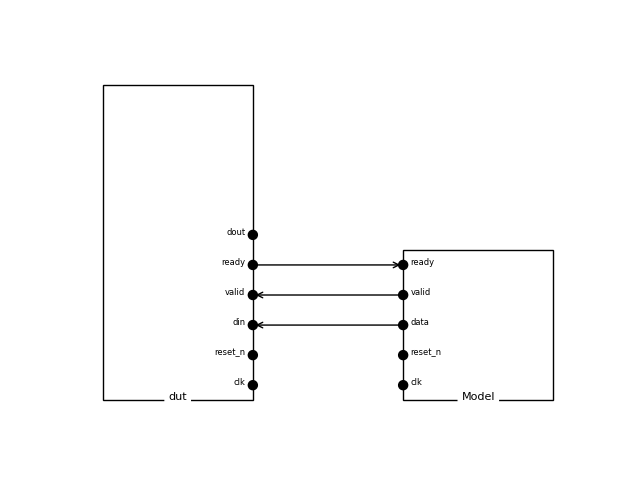
まとめ
Pythonでブロック図を作成するスクリプトを作成しました

コメント